Millionaires are made when the stock market crashes, and the bigger the decline, the bigger the opportunity, especially if we can be greedy when others are fearful. So in this post, I'll show you everything you need to know about the latest market downturn and which stocks could win big as a result. Your time is valuable, so let's get right into it. First things first, the most important thing that every investor needs to do is make moves based on data and facts, not feelings.
That's not always easy, which is why I'm making this video. I'm also not here to hold you hostage, so here's what this video covers up front. What just caused this latest market drop and why? How far stocks could fall and for how long? The best way to be greedy when others are fearful? And of course, which stocks I'm buying if prices continue to tank. There's a lot of ground to cover, so let's dive right into this latest market downturn.
Table of Contents
1. What Caused the Latest Market Drop
2. How Far Stocks Could Fall and for How Long
3. How to Be Greedy When Others Are Fearful
4. Which Stocks to Buy
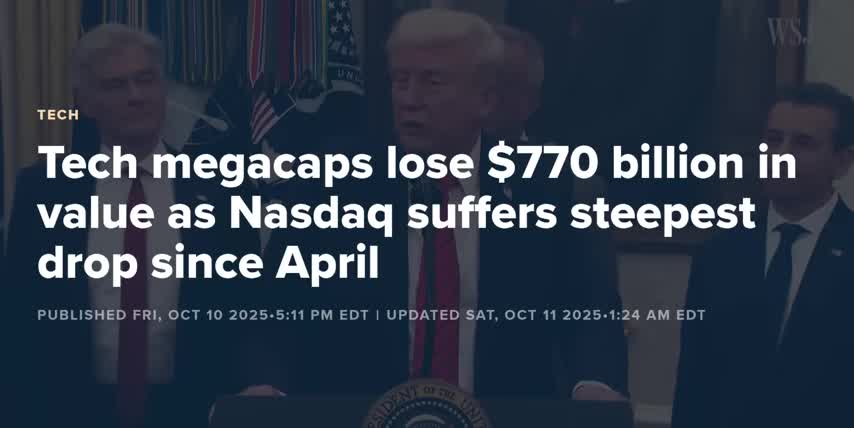
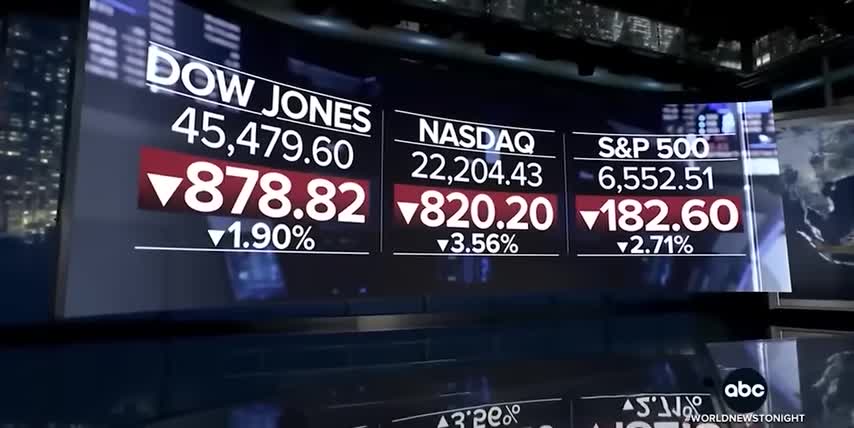
Stock markets around the world dropped as President Trump threatened a new round of tariffs on China. Both the S&P 500 and the NASDAQ posted their worst day since April after Donald Trump said he would impose a 100% tariff on goods imported from China over and above any other tariffs they're currently paying. And that number is effective November 1st, just 19 days from when I'm recording this video.
This is in response to China announcing expanded export controls on rare earth elements, including restricting their exports, requiring that foreign companies obtain special licenses to export products containing even trace amounts of Chinese rare earth materials even if they are manufactured out of China, and adding additional restrictions for semiconductors and AI related products specifically.
There are a few important factors that make today's situation different from April's Liberation Day tariffs. First, China currently controls around 70% of the world's rare earth supply and over 90% of the processed rare earth materials and magnets, which are critical to everything from AI chips and electric vehicle batteries to jet engines and defense systems, so pretty much every market we invest in.
At least 7 rare earth elements go into the chips themselves and the machines that build them, which means almost every chipmaker and AI hardware company could see some serious supply chain disruptions thanks to these new export controls. On top of that, Trump's new export controls include all AI and semiconductor-related software, so AI companies are really getting hit from both sides.
Second, while tariffs on Chinese goods peaked at 145% after Liberation Day back in April, they were quickly lowered to anywhere between 10% to 30% once both sides agreed to a 90-day pause for renegotiations and there was another extension in August. So even though the trade war tanked the stock market in the short term, it quickly rebounded as both sides came back to the table. And we made a lot of money by being greedy when others were being fearful.
And I'll go over exactly how in a little bit. But this time is different. This week's escalations have a much higher starting tariff rate, 100% on top of pre-existing tariffs instead of just resuming previous rates, as well as broader coverage, not just goods but also critical materials, port fees and tech exports.
There's also a big shift in tone here, with President Trump commenting that high-level negotiations might not even take place, suggesting that both sides are willing to endure much more economic pain than they were back in April which means these tariffs export controls and trade restrictions could stick around longer than previous versions And the big problem with that is that semiconductor supply chains take many years and many billions of dollars to set up We're talking about building and maintaining huge factories full of extremely expensive and intricate machines, training specialized staff and optimizing complex processes, and so on.
So AI hardware manufacturers aren't just going to pick up and move to another country to avoid these tariffs. They're simply going to pass the added costs on to their customers. In fact, a study by the National Bureau of Economic Research found that the costs of President Trump's trade war back in 2018 were passed entirely on to importers and consumers, while the Federal Reserve said that the 2018 tariffs led to increased job losses and higher prices.
Higher unemployment and higher prices mean lower spending by consumers and businesses, which means lower revenues and profits for companies and ultimately lower stock prices. That's the connection between Trump's tariffs and the stock market going down right now. But how far could stocks fall and how worried should investors actually be? We don't want to rely on emotions or gut feelings for the answer. So let's look at some historic market data next.
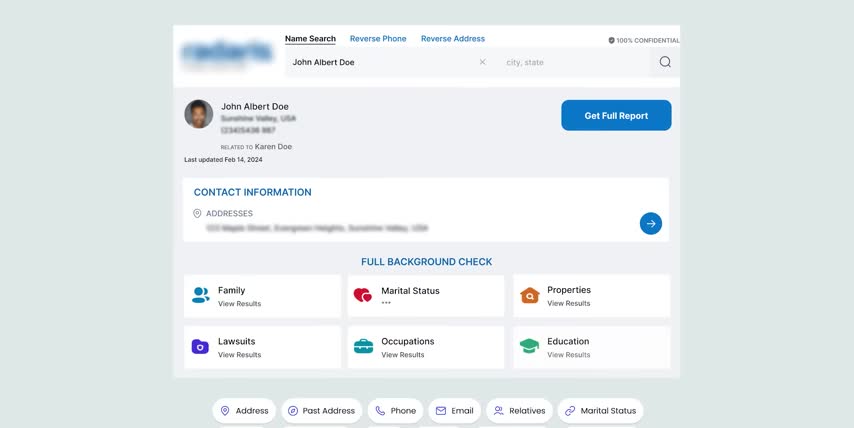
And speaking of data, I found out that over 100 online data brokers were selling my personal data. And they might be selling yours too. That's why I joined DeleteMe, the sponsor of this video. So, DeleteMe is a hands-free subscription service that will remove your personal information from hundreds of online data brokers. You just sign up, enter your information, and let their experts get to work. They've reviewed over 51,000 listings for me so far, saving me countless hours in the process.
After 7 days, you'll get a privacy report showing everything they've done. I've been with DeleteMe for years now, so I just got my 12th report and these data brokers had way more than just my personal information. They had my wife's and my entire family's too. But here's the best part. They'll keep scanning these websites even after they remove my data. And I get my own privacy advisor if I want to talk to a real person and make a custom removal request.
So if you care about your data and your family's privacy, you can get 20% off any consumer plan with my code SYMBOL20 by going to joindeleteme.com slash SYMBOL20 or with my link in the description. And a big thank you to DeleteMe for supporting the channel and keeping my family's data safe. Alright, let's look at some data from previous market crashes to see how far stocks could actually fall.
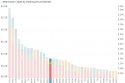
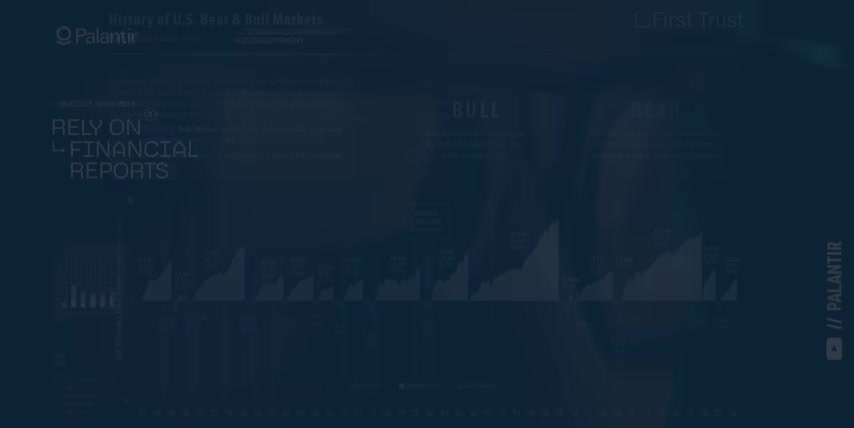
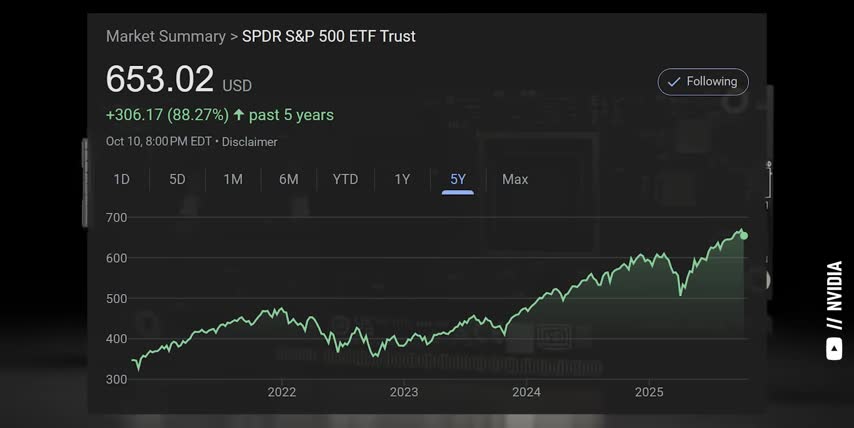
This is one of my favorite charts from First Trust, showing the S&P 500's performance for every bear and bull market going back to 1942. The x-axis is time, the y-axis is total returns, and the vertical bars show recessions. It turns out that bull markets last around 4.3 years, and they return a total of 150% on average, which works out to about a 24% compound annual growth rate. On the flip side, the average bear market only lasts 11 months, and it draws down by around 32%.
So while bear markets are around 50% steeper, bull markets last over 300% longer, returning all the losses from bear markets and then some. This is why millionaires are made when the stock market drops. They become huge windows of opportunity to buy great stocks at deep discounts. This is also why my channel focuses on long-term investing. It takes years for markets to hit the top and recover from their bottom.
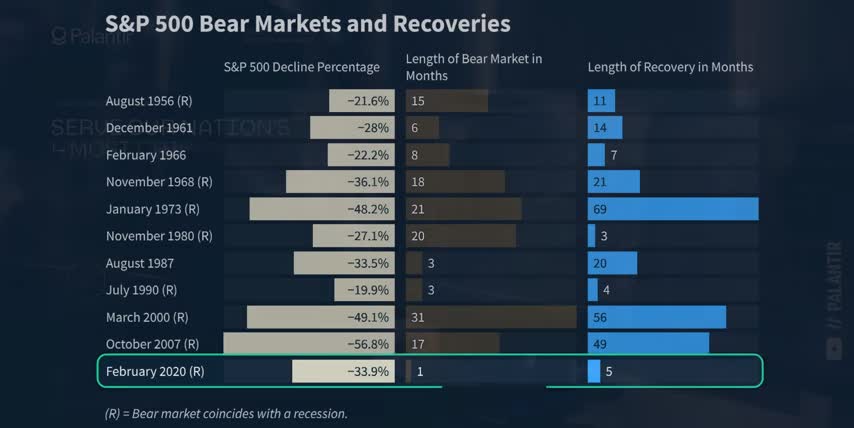
Here's another study that splits bear markets into their declines versus their recoveries. For example, the S&P 500 dropped by 21.6% over 15 months in 1956 and then took another 11 months to recover from the bottom.
But look what happened during the pandemic where the S 500 dropped by 34 in a single month and it only took 5 months to recover There are two big insights from this study that will make millionaires as well First, looking at data from previous market crashes isn't the same as holding through one. Most of us would probably say that we'd rather take the crash from 2020 over the one in 1956, since that one took 15 times longer to bottom, and it took twice as long to recover.
But in reality, the 2020 crash was much, much harder to hold through since the decline was so sharp and sudden, averaging almost a 2% decline per trading day for a month straight. The second insight is that even though the shortest bear markets jam all that panic selling into a matter of weeks, the average bear market actually takes about a year to bottom and about two years to fully recover. Not weeks, but years.
That's why it's so important to keep cash on the side and to dollar cost average in over Alright, so far we've covered what's causing this latest stock market drop and we've looked at some important historic data to see how far stocks could fall and for how long. But how do we know when to be fearful and when to be greedy? Guess what? The answer is by looking at even more data. This is CNN's Fear and Greed Index, which I'll leave a link to below for you.
The index goes from 0 to 100 and it's currently showing fear in the market. You can also see a 1-year timeline, which is a good way to see how fast the index fell from greed to fear after President Trump threatened another round of tariffs late last week. This is very useful information for anyone looking to be greedy when others are being fearful.
What I like about the Fear and Greed Index is that it's actually calculated from seven useful market indicators, like stock price momentum, strength and breadth, the ratio of puts to call options, market volatility, and demand for stocks vs. bonds. All different measures of risk in the market. Out of the 7, I tend to pay attention to market momentum and volatility the most.
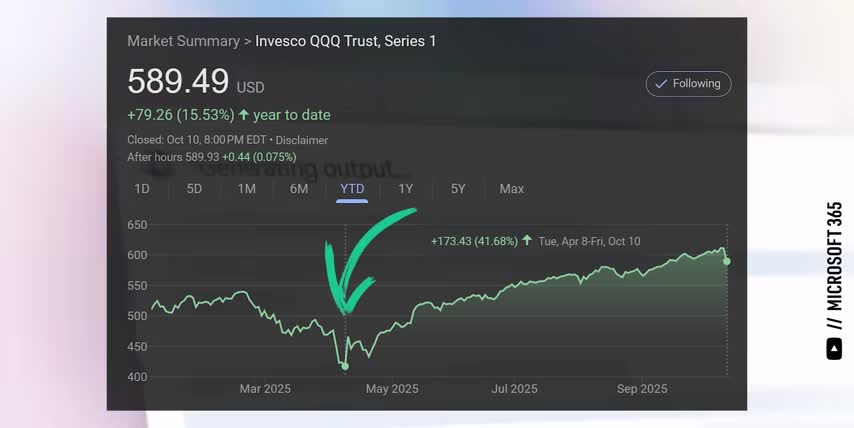
I like to dollar cost average into my favorite stocks even more aggressively when market momentum dips below the 125 day moving average, which is 6 months of trading days. As you can see, we're not there yet. But look what happened back in April. Market momentum was well below the 6 month average, from March 13th all the way to May 7th, which ended up being a great window to buy stocks. momentum bottomed out on April 8th, the exact same day the S&P 500 bottomed.

I like to buy stocks when the VIX, which measures the S&P 500's volatility, spikes to around 30 or higher, which also hasn't happened yet. But if we look back at the VIX in April, we can see that it topped out on April 8th, again the exact bottom for the S&P 500. That's why I made so many videos in April covering the Trump administration's tariffs, while this index was showing extreme fear. This is a powerful tool for knowing when to be greedy and when to be fearful.
And personally, right now isn't the time for me to be greedy just yet. I'm waiting for the VIX to get closer to 30 and I'm waiting for market momentum to drop below its 6 month average first. Alright, now that we have all that context, we can talk about which stocks to buy when the time is right. And if you feel I've earned it, consider hitting the like button and subscribing to the channel.
That really helps me out and lets me know to make more content like this thanks and with that out of the way let's talk some stocks like i've been saying all year the foundation of every good long-term portfolio starts with a fund that's especially true if you're a newer or more emotional investor with itchy fingers i'm not judging you we've all been there all the data we've looked at throughout this video tracks the s p 500 but it applies just as much to the nasdaq 100 since they have so many holdings in common and they tend to move together The Nasdaq has a few advantages over the S like not being limited to US companies and not holding commercial or investment banks.
And since it only holds 100 companies compared to the S&P's 500, the Nasdaq tends to make higher highs in bull markets and lower lows in bear markets, like the ones we just went over. Exactly what I want when I'm being greedy when others are being fearful. And if you're in the US, check out VGT, Vanguard's information technology ETF. VGT holds more companies for diversification, lets their winners ride for longer for performance, and has lower fees than the NASDAQ.
As a result, it tends to make slightly higher highs and lower lows with a lower cost. But just to be clear, both of these funds are great foundations for any long-term portfolio. When it comes to individual stocks, I'm looking for two things. First, I want them to be affected by these latest tariff announcements, since I don't think another 100% tariff on China will last for very long. I also want them to be core holdings for the AI era.
That way, even if I'm wrong, they're all stocks I'm comfortable holding for the long term. First up is CoreWeave. CoreWeave is an AI-focused cloud computing company that provides infrastructure for AI workloads, in the form of GPU clusters, high-performance storage, and high-bandwidth networking. Not only does CoreWeave get priority access to Nvidia‘s latest GPUs, but they're also one of Nvidia's biggest investments, which is why I'm comfortable holding this stock for years and years.
Discounted cash flow models like Simply Wall Street's show CoreWeave as 33% undervalued today. Said another way, CoreWeave's stock would have to go up by 50% to hit its fair value. That's a 50% upside on a company sitting at the center of the AI revolution. Like I said at the start of this video, millionaires are made when the stock market crashes. And now, you can see why. The next company I'm watching like a hawk is Amazon.
There's no doubt that an additional 100% tariff on Chinese goods is going to affect their e-commerce business. And the same is true on the AI chip and software side for Amazon Web Services. Amazon currently trades at a price-to-earnings ratio of 33, which is below its average for the last two years. And according to DCF models, Amazon is currently 20% undervalued, which means it already has a 25% upside from today's prices.
But I think that's a conservative estimate, because analysts and models tend to undervalue the growth of Amazon Web Services and Amazon's advertising business. Most investors still don't realize that Amazon is the fourth fastest growing advertising company on the planet, only behind MercadoLibre, Reddit, and TikTok.
And that's on top of their massive e-commerce and cloud service businesses it's also the third largest advertising company only behind google and meta platforms speaking of which meta platforms is currently 36 undervalued giving it a 56 upside from today's prices talk about an obvious slam dunk investment for the ai era so hopefully this video helped you understand what's causing the latest market downturn how bear markets compare to bull markets, exactly what data to use to be greedy when others are being fearful, and of course, some great stocks to watch for when it's actually time to pull the trigger.
Because relying on data instead of emotions is the best way to get rich without getting lucky. And if you want to see what else I'm buying to get rich without getting lucky, check out this video next. Either way, thanks for watching and until next time, this is ticker symbol you. My name is Alex, reminding you that the best investment you can make is in you. Thank you.
Key Takeaways
- Millionaires are made when the stock market crashes, and the bigger the decline, the bigger the opportunity.
- It's essential to make moves based on data and facts, not feelings, when investing in the stock market.
- The average bear market only lasts 11 months and draws down by around 32%, while bull markets last around 4.3 years and return a total of 150% on average.
- The Fear and Greed Index is a useful tool for determining when to be greedy and when to be fearful in the market.
- Companies like CoreWeave and Amazon are potential investments for the AI era, with significant upside potential.
Checkout our YouTube Channel
Get the latest videos and industry deep dives as we check out the science behind the stocks.