Mentioned in Video:
- Trade Notifications – https://ark-funds.com/trade-notifications
- All ARK Invest emails – https://ark-invest.com/subscribe/
- ARK Invest Big Ideas Report 2020: https://ark-invest.com/big-ideas-2020/
- ARK Invest Big Ideas Report 2019: https://ark-invest.com/articles/analyst-research/big-ideas-2019/
- OTHER RESOURCES (NOT AFFILIATED WITH ARK INVEST):
- 🧮 ARK ETF Calculator for YOU – https://www.patreon.com/posts/45492467
- 📜 State of the ARK #00 – Week 52, 2020: https://www.patreon.com/posts/state-of-ark-00-45430978
- Support the channel and get extra member-only benefits by joining us on Patreon: https://www.patreon.com/tickersymbolyou
Wondering which #ARKInvest fund is the best? Looking to follow #CathieWood‘s trades from overseas? Here are the best resources for tracking #ARK Invest in 2021. All of these resources add value and new ways to look at ARK Invest's trading data.
Video Transcript:
[00:00:00.120]
I think more and better and more valuable community is coming through mechanisms like StockTwits and other things. There are some really smart people who want to be in this community to help. You know, there's a real correlation with wealth and happiness, I think. There's a correlation for people to want to help.
[00:00:20.760]
Hey there, Alex here. And this is Ticker Symbol: You, the channel that invests in you. I'm making this video, because I realized that many people watching and discussing in the comments below are using different online tools and communities to gather and share information surrounding ARK Invest.
[00:00:36.510]
So the purpose of this video is to make you aware of as many useful tools and engaging communities so that you have everything you may need going into 2021. I'm excited to highlight some of the best work going on in the investment community surrounding ARK Invest, all of which will be linked to in the description below so you can pick and choose the ones that are right for you. I hope you enjoyed this community highlight and let's dive right in.
[00:00:59.940]
We'll start with arktrack.com, which allows you to quickly see changes 1, 7 or 30 days ago or compare ARK holdings between any two specific dates, which is a fantastic feature. It looks like it can go back about 10 weeks, so you can see changes in position sizes over almost an entire quarter, which would be 13 weeks long. It also allows you to limit stocks to just those on Trading 212, which is a very useful feature for people who live outside the U.S. And, you can change this table to display only the information that you care about.
[00:01:33.360]
Arktrack.com also lets you plot many different things at the fund or individual stock level, and most of the plots are pretty good. When you look at things by fund, you're seeing all of the holdings in that fund at once. You can see the number of shares, the change in shares, the dollars, the change in dollars or the weight of every stock in that fund. When you look at an individual stock, you can see how it's doing across all funds that it's in by weight.
[00:01:59.580]
I'm hoping that they add another tab here for all funds combined because the whole toolkit is really great, it even lets you link a specific view so you can quickly share your analysis with others. If you're tracking ARK Invest's changes on single positions because you're investing in a way where you can't buy their funds directly, arktrack.com may be the tool you're looking for. Lucidtracking.com is meant to be used with a desktop and a wide screen monitor, but it's an absolute powerhouse with the right setup.
[00:02:27.300]
It provides a set of dashboards that track ARK's changes in position over time in any combination you can think of. Here, we can see the daily buys and sells by fund as well as all of the funds combined. They're also going super hard on tracking by change in rank, fund by fund and at the combined fund level. It's really impressive stuff. Below that you get a set of bar charts for each stock in each fund where you can quickly see the changes in position over time.
[00:02:54.870]
And of course, they also have a set of bars for the totals for each stock across all funds combined. I mentioned that Lucid Tracking is best on a desktop with a wide screen, and these dashboards are why. This visualization style just requires a lot of real estate to show the full picture simply because ARK currently holds over one hundred and fifty stocks across their five funds. All the bar charts are the same width and you can change what each bar represents in the menu at the bottom.
[00:03:22.350]
They also have a weekly buy and sell option, which is going to be great. They're still working on that feature, but they're constantly adding new features to make tracking ARK's trades even easier and smoother. In addition to the dashboard, Lucid has several very useful tables. The aggregate table shows you ARK Invest's total changes in position and can be sorted by one day, seven days, fourteen days or thirty days. Both changes in shares or dollars. I'm sure they're going to add a rank and rank change column here soon, which would really make this table a solid one stop shop for all things ARK data.
[00:03:57.240]
They currently keep rankings on a separate table which tracks them overall as well as fund by fund. Combining these two tables seems like the next logical step, and I'm a huge fan of the work Lucid Tracking is doing. It's definitely worth checking out. ARKwatcher.com is an email newsletter that shows you ARK Invest's biggest position changes daily. The people who run it are constantly making improvements, like making it more clear when in time a new position is started and when one is dropped.
[00:04:25.500]
Each bar on the banner for a given stock is one day wide and the most recent trading day is the one on the furthest right. So, for example, a new position was started in Magna International, ticker symbol MGA, and it's a three point four two million dollar position. Likewise, you can see that Slack, ticker symbol WORK, was completely dropped about seven bars ago. So about seven trading days ago. Veeva Systems, ticker symbol VEEV, was picked up about three trading days ago,
[00:04:56.880]
and it looks like ARK Invest doubled their position on day 2 and increased their shares by another 10 percent on Thursday, December 24th, 2020, the most recent trading day for this newsletter. There's also a weekly version you can get, which I'm pretty thankful for, since it's an easy way to crosscheck my own data, since I collect it week to week. And in fact, I can tell you that all of this lines up with my weekly buys and sells for this trading week, which I'll cover at the end of the video.
[00:05:26.040]
ARK Watcher's website allows you to search for specific tickers, new positions or even stocks with earnings calls in the next month. That's a really great feature for swing traders like me who buy the rumor and sell the news around earnings. Some next steps I'd want to see for arkwatcher.com is to allow you to see recently closed positions, say, in the last month or so. It already lets you sort by total market value, which is the same thing as the ARK Rank.
[00:05:51.850]
It also lets you sort by change in total market value. But that's not exactly the same thing as change in ARK Rank. If they went the extra step to calculate the actual ARK Rank change and sort by that, this would quickly become my personal go to tool. Just because it's so clean, simple, works well on mobile and the information comes to me via email. CathiesARK.com is another clean table based tracker that will show you many things at the fund level
[00:06:18.520]
and then let you dive into a specific stock. At the fund level, it can show you the rank of every position, the latest share price, the market cap and which funds the stock is in. I think it would be really cool to show the dollar amount or the weight of the stock in each fund it's in. For example, Tesla is around 10 percent of each fund listed here. CathiesARK.com is making some pretty cool visualizations at the fund level as well.
[00:06:43.300]
Like the spaghetti plot I've shown in recent videos. I'm excited to see this feature get fleshed out and also to see it for all funds combined. But for now, you can see this for each ARK fund. They also look at the 45 day accumulation of shares inside a given fund, which is a neat way to show outsized position changes over time. I'd love to see this feature for all funds combined as well, instead of just fund by fund and also to track it by rank instead of just change in share count. Before I switch to the system I use
[00:07:12.070]
now, this is actually the way I found big changes in rank two. So it's cool to see features like this at Cathie's ARK. Cathie's ARK also has a discussion forum called The Trading Floor, which allows people to post and reply to quick thoughts on all things ARK, as a cool discovery tab, which is a fun way to peruse different discussions happening inside the forum. You can check things out by top posts, featured posts or by individual topics that you choose to follow.
[00:07:39.070]
This is one of those ARK Invest specific communities that I'm really excited to see grow over time. And speaking of discussion communities, you should be aware that there are many investing communities on Discord, which is basically an app like Slack, but more leisure and gaming focused and has a really smooth interface that makes collaboration super easy. My favorite free Discord community is one called Dumb Money, which was started by Chris Camillo, Dave Hanson and Jordan McLain. Chris Camillo is the author of Laughing at Wall Street,
[00:08:08.530]
and their whole community focuses on finding outsized gains before Wall Street gets in. They do a ton of great research and provide a lot of organization to different types of investing styles. They have a YouTube channel called Dumb Money as well and are pretty big fans of ARK Invest. You can see that the community has a wide variety of channels to check out. So if you have broad investment interests, you should check out Dumb Money. It, of course, has a dedicated ARK Invest channel and you can see a bunch of the great research people are doing here.
[00:08:37.480]
The second Discord is called Stock Hub, which is the community associated with financial education channels, run by Jeremy Lefebvre. If you don't know the name, you definitely know the face. And if you don't know the face, you probably recognize the hat. Both of these communities, Dumb Money and Stock Hub are very large and diverse. They feature hundreds of channels covering different stocks, different trading styles such as value investing, real estate focuses and different sectors: restaurants, casinos, financial technology, electric vehicles and so on.
[00:09:10.060]
I'll leave a link to the invites for these Discords in my description below. Stock up, of course, also has a dedicated ARK investment channel. And finally, because over 500 people showed interest, I'm also starting a Discord. It's dedicated solely to investing in disruptive innovation. I'm still working on the permissions and channels, but the idea is to have it so that people who just want to plug in and have read only access can do so, while patrons can enjoy more nuanced research and data driven discussions, there will be a channel dedicated to each ARK fund as well as each disruptive technology and other major disruptors that are not yet public.
[00:09:46.810]
For example, Elon Musk's SpaceX. There will also be sections for group research, project requests and all the other stuff that comes with being a more narrowly focused community. My hope is that this community will directly help me produce more content through crowdsourcing the research in an organized way. So if you're trying to directly impact this channel and make connections around investing in disruptive innovation, hopefully this community is for you. Just so you're aware, Patreon charges at the first of every month.
[00:10:16.230]
So if you're not sure if this community is for you, feel free to sign up after that and give it a test run for a few weeks. Speaking of which, my newsletter for this past short trading week ending Thursday, December 24th, is already up on it. It's publicly available because I wasn't planning on covering ARK's positions and trades in a video this week until I got an interesting question from one of my supporters. They wrote, “It would be really cool if you could publish a spreadsheet where somebody could enter the total number of shares they own of each ARK fund and have it add up the shares of each stock that makes up that overall position, like how many shares of Tesla, Roku and so on they own based on the weights in each ETF. There are many investors using multiple ARK funds to diversify and would like to do an analysis on different investment levels into each fund.
[00:11:03.540]
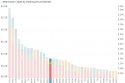
No one is doing this today.” I'll leave the diversification data to some of the other tools and communities I've already highlighted, since they can already easily tell you which stocks belong to which sectors and what the market cap is for each. But I'm definitely happy to do my part to help the community with the rest of this analysis. Here's the sheet I built to help solve this problem. It's available on Google Sheets and linked in the description below. The first thing it does is provide a bar chart of everything and all of ARK Invest's actively managed ETFs, sorted by fund and then by holding size, it goes from biggest to the smallest fund.
[00:11:37.320]
And this is one way to see the relative size of each ETF, how they overlap and what the biggest stock is in each fund. The bar chart should answer questions like how much of a given stock does ARK Invest hold and in which funds. Instead of asking which fund a given stock is in, you can ask how much does each fund overlap? And that's what this area chart is trying to show you here. The fund order is the same from left to right as the bar chart, starting with ARKK ending with ARKF.
[00:12:07.350]
Sorry, the legend doesn't reflect that order. I tried a few different things to change it and they didn't work, so I moved on. As you can see, all of the funds have significant overlap with ARKK. So when people ask me how to spread their investments across all five funds or all four besides ARKK, I always try to convey that the purpose of ARKK is to grant exposure to all of the innovation platforms and technologies that ARK Invest believes in.
[00:12:32.940]
And now you can see that in the data. Also, when you're choosing to buy all four funds and manage the relative sizes yourself, you're implicitly making the statement that you think you can do better than Cathie Wood, since that's what ARKK seeks to do as a financial product. Manage the ratios of exposure between genomics, artificial intelligence, energy storage, autonomous robotics and so on. I'm not saying you're wrong to do that, by the way. I'm simply making sure you understand the forward looking statement that I feel you're making when you choose to buy the other four funds instead of buying the fund that combines them.
[00:13:07.590]
As you can see, there's limited overlaps between the other funds, but they do exist, especially between ARKW and ARKF, both of which seek to disrupt traditional market leaders via digitally native, rapidly scaling alternatives. The next tab of the sheet shows you a breakdown of the dollars and each stock and which fund they're in. So you can directly compare funds by stocks. So, for example, you can see that Tesla is the top position. There's two point six billion dollars in Tesla overall and it's split up among ARKK, ARKW and ARKQ.
[00:13:40.830]
The next position is Roku and you can go down and down the list this way. And finally, there's a tab for each fund where you can see each holding, its weight, the closing price per share and how much money you'd have in each stock based on the amount of shares you have and the current price of the fund. A few quick notes about these fund specific sheets. You should only fill in cell A2 the current price, and so B2 the current number of shares you have,
[00:14:05.700]
and from there it subtracts the 75 basis points for the expense ratio only once, which isn't fully correct, but it's better than not taking it out at all. Then it shows you how much money you have in that fund in total in cell D2, that's the amount of dollars the sheet will distribute across each stock based on its weight in the fund, to show you how much money and how many shares you would have in each. That's columns A and B.
[00:14:30.600]
You'll also notice that the date cell is bright red. If you select that cell, you'll see that it calls a function that reads ARK's data directly. This works because ARK Invest updates their holdings sheets each day but doesn't change the URL of the sheet itself. If you load my spreadsheet a week from now and you want to see the latest number, simply click into the date cell and hit enter twice, it will execute the import data command and update the sheet for you automatically.
[00:14:59.130]
You'll have to do this for each of the five funds the exact same way, by clicking into the red date cell and hitting enter twice to run this import function. Then, you want to make sure you scroll down to the bottom of the sheet and verify that columns A, B and K, which are marked as the three derived columns, cover each stock in the sheet. And if we go back to the fund comparison sheet, that's what's going on in the top row.
[00:15:25.810]
It's warning you to make sure that all five individual fund tabs are synched to the same date. You now have access to a self-updating spreadsheet of ARK Invest's actively managed ETFs; calculators for what equivalent stocks you'd be holding based on your investment in each, and a chart giving you the overall picture of their funds, as well as how those funds overlap. And if you somehow muck up the sheet, you're always able to get a fresh one from the link I've provided in the description below.
[00:15:55.000]
So, feel free to either make a copy or download it and play with it to your heart's content. Boom, no middleman. Well, actually, I guess I'm a middleman, so you should be aware that you can sign up for information straight from ARK Invest. Occasionally, I chat with somebody who has only recently begun following ARK Invest and they're blown away when they realize that ARK Invest provides direct access to their latest trades and commentary on the most volatile stocks that they have positions in.
[00:16:22.120]
I'll leave a link to sign up for their daily trade notifications and weekly stock commentary in the description below. And I advise you to set an email filter to make sure that anything from ARK-funds.com or ARK-Invest.com is never sent to spam. Also, a quick note on this trading email. I believe that it only covers outsized buys and sells: specifically anything that would change the weight of a position in a given ETF. So if you're wondering why some trades don't show up in the email, it's because that trade just maintained that stock's ratio in the fund as the fund itself continued to grow.
[00:16:58.180]
I believe this last column shows you the amount of the fund that was given purchase changes. Just to be clear, this is my opinion. And if I have it wrong, please let me know in the comments. If you're also looking for the research side of things, you should know that their 2021 Big Ideas presentation is happening in January. Their Big Ideas 2020 and 2019 presentations are big picture overviews into all of their different research areas for the year.
[00:17:24.700]
A link to both of those in the description below as well. And many of my videos often start with me reading those to know what to research next. Let me know if you're interested in me live streaming Big Ideas 2021 or if you just want me to cover the highlights. I've never live streamed, but this seems like a great event to start if you're interested in me doing so. Hopefully I covered at least one website community or ARK Invest item that may be useful to you.
[00:17:50.320]
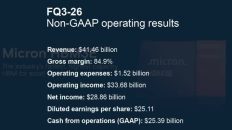
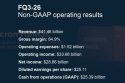
If not, I at least hope that you find my Google spreadsheet useful and consider giving my Discord a trial run. Great. Since we're already here, let's quickly cover ARK Invest's biggest trades for the short trading week ending Thursday, December 24th 2020. Assets under management: ARKK, ARKF and ARKQ grew by ten to fifteen percent each, as usual. ARKW grew by only two percent but ARKG grew by a whopping twenty four point four percent this past trading week.
[00:18:19.060]
People are buying into the genomics revolution like crazy. So making sure you account for ARKG's massive fund growth when you see the big numbers is becoming ultra important, because ARKG grew by almost one point five billion dollars this past trading week. Here is the new trading board. Hopefully it shows it better now on mobile. Each cell contains a stock ticker, that stock's current rank, its weekly change in rank, and that increase or decrease in amount of shares held. When it comes to changing rank
[00:18:48.460]
a lowering in rank is better since no. one is the best rank and the trading board is now covered by this change in rank. No longer percent change in shares. So the greennest squares or the ones with the biggest lowering in rank are Apple, AAPL, Google, GOOGL and Long View, LGVW. And the most red squares are TransUnion TRU, Interactive Brokers, IBKR, and Xilinx, XLNX. New positions for the week are Magna International, ticker symbol MGA, Veeva Systems, VEEV and Open Door Technologies, ticker symbol OPEN, which was Chamath's IPOB.
[00:19:33.880]
Sold out positions for the week include IPOB since it no longer exists. Slack, ticker symbol WORK, which we've covered extensively, and Zscaler, ticker symbol ZS, which we've also seen ARK Invest selling out of week after week. The biggest movers are sorted by the rightmost column in this table, which is the change in ARK rank. And I'm showing every stock that moved up by ten or more ranks and then every stock that moved down by 10 or more ranks.
[00:20:01.870]
Note that plenty of stocks that moved down 10 ranks are actually really good companies. Like CloudFlare, Netflix and Fastly and that ARK Invest didn't actually sell shares of any of those stocks. They simply chose not to buy them as the rest of the funds continued to grow, which is the same thing as shrinking these positions over time. So, again, the biggest positive movers are Apple, Long View and Google. And the biggest net negative movers are Xilinx, Interactive Brokers and TransUnion.
[00:20:32.830]
I read every single comment and, as you know, reply to most of them. Let me know in the comments below if you found this episode useful or if roundups and highlights like this one aren't that valuable to you. Personally, I can't wait to see what innovative things this wonderful investment community comes up with in 2021 and beyond. This is Ticker Symbol: You, my name is Alex reminding you that the best investment you can make is in you.
If you want to comment on this, please do so on the YouTube Video Here